
Need help with the spreadsheets?
Post your question into our Google group. Add a link to the page where you got the spreadsheet from, so that others might find it later.
Jump to
RSI indicators are group of technical analysis tools that traders use to gauge momentum of a market.
The group of RSI-based indicators includes the basic RSI, or relative strength index, as well as various transformations of it - the stochastic RSI or the Inverse Fisher RSI.
Many traders don’t worry about how RSI actually works or how to modify the RSI settings to give a better fit for the market you are trading. It’s good to see that there is more of a curiosity among cryptocurrency traders as this is what leads to innovations and inventions.
The truth is you can use RSI and its transformation on any kind of data that progresses over time to understand the momentum of its changes. RSI indicators are useful for market metrics - price, volume, you name it - but can be used for marketing data, traffic stats and other things as well. If you get comfortable using RSIs as a tool, one day you might be able to build your custom tools that will fit your style of trading or analysis better than generic metrics, and essentially become a power user.
In this article we will go through pine script RSIs for traders on established markets who use TradingView charts and through RSI formulas for Excel or Google Spreadsheets for data that are not readily available on charting platforms.
If you are just here for the Google Sheets template, there you go:
Pine Script RSI recipes
Pine script is the scripting language that powers technical indicators at TradingView. The backend of every indicator is freely available for anyone to see, copy or edit.
Pine scripting is a powerful tool for analysts and traders with a more visual approach who like to see things charted. Step 1 - Sign up for TradingView free plan to access TA library
To start working with RSI indicators, just go to Tradingview’s public library and look up the default Relative Strength Index indicator.
- Get a free account here to access TradingView
Step 2 - Look up the basic RSI pine script
Make a chart of any market you’re interested in, let’s say BTCUSD at Kraken.
- Click the little “Fx” icon in the top left navigation and lookup RSI from the search dialog
- Clock on the top result (the basic built-in indicator) to load it into your chart

Step 3 - Read the pine script
Once the basic RSI loads into your chart, click the {} icon to see it’s pine source code. It will open in one of the tabs at the very bottom of the window.

This is the basic RSI indicator source code in pine:
//@version=4
study(title="Relative Strength Index", shorttitle="RSI", format=format.price, precision=2, resolution="")
len = input(14, minval=1, title="Length")
src = input(close, "Source", type = input.source)
up = rma(max(change(src), 0), len)
down = rma(-min(change(src), 0), len)
rsi = down == 0 ? 100 : up == 0 ? 0 : 100 - (100 / (1 + up / down))
plot(rsi, "RSI", color=#7E57C2)
band1 = hline(70, "Upper Band", color=#787B86)
bandm = hline(50, "Middle Band", color=color.new(#787B86, 50))
band0 = hline(30, "Lower Band", color=#787B86)
fill(band1, band0, color=color.rgb(126, 87, 194, 90), title="Background")
Translation from pine into English:
- Call it Relative Strength Index.
- Take 14 past candles for the length.
- Retrieve their values at Close all over your length.
upanddown: Compare every two consecutive Closes and find out if the price went up or down between them.- If the price went up, set the
downvalue to 0. If the price went down, set toupvalue to 0. - Still on the same line: Get the weighted moving average of both
upanddownover your length. - Scale the ratio of averaged up vs down to fit between values of 0 and 100 to make it into a relative index.
- Color it pretty!
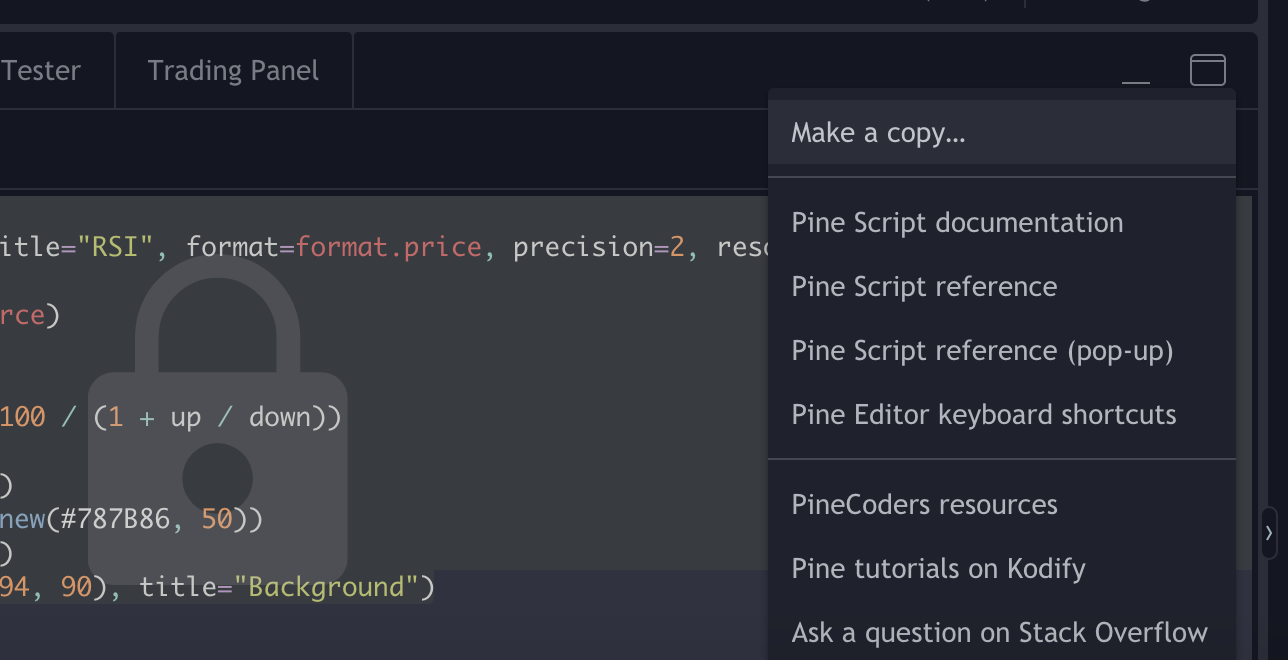
Step 4 - Make a copy to tinker with it
The basic version of RSI indicator is locked for editing, but much like with Google spreadsheets, you can click “Make a copy” to copy it into your own account. That copy can then be edited in any way you like.
RSI formula Excel / Google Sheets
There is no built-in formula for RSI indicators, neither in Excel nor in Google Sheets.
Because of that, the workflow of creating RSI is the same for Excel and for Google Sheets - you just need to do stuff manually.
So, to create the basic RSI indicator formula in Excel or in Google Spreadsheet, you pretty much just need to follow the operations done in the pine script above.
(Dirty little secret - you can translate most indicators from pine into Excel this way, or vice versa.)
Get the template directly if you want to, but let’s also take it step by step so that it’s not a complete black box.
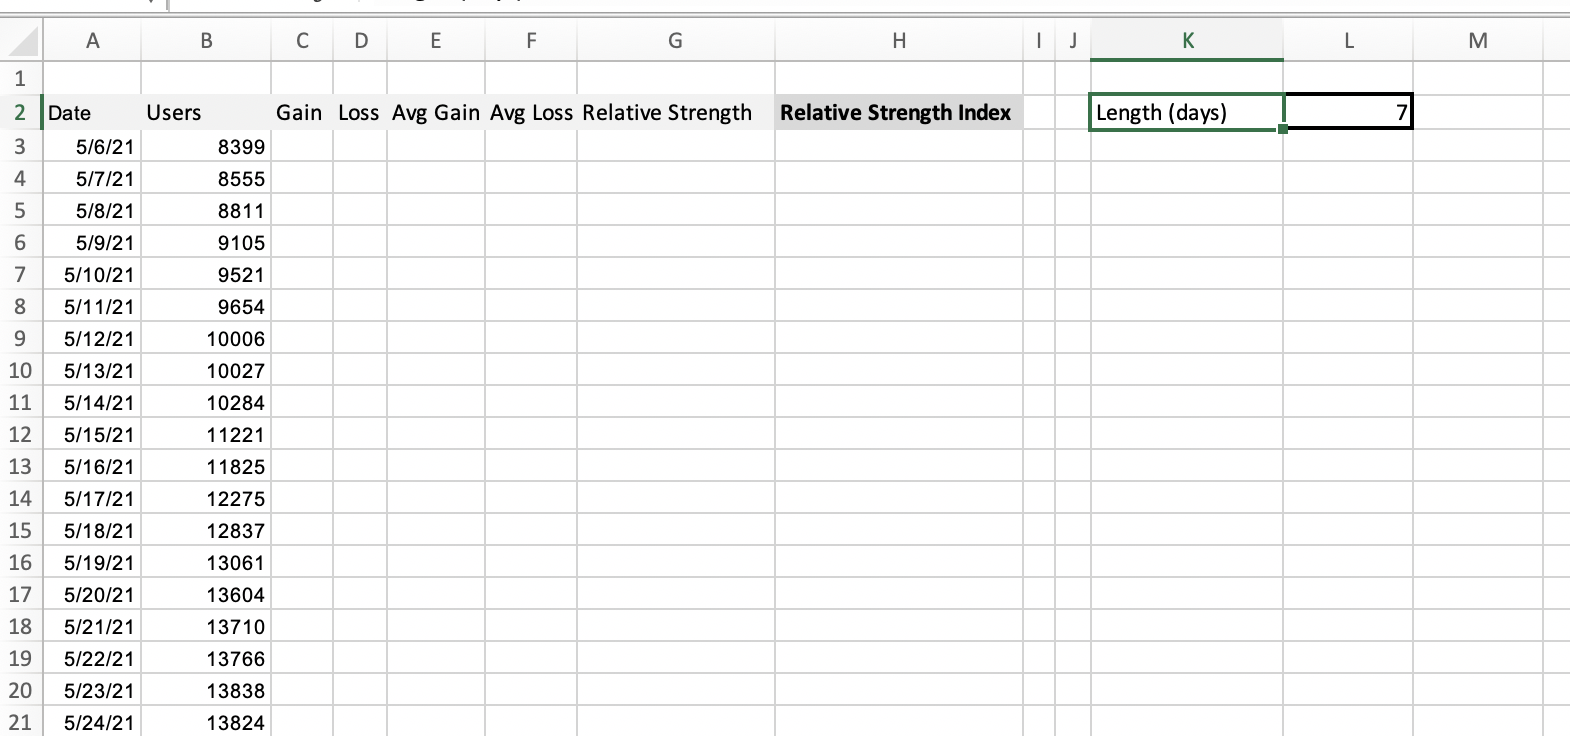
Step 1 - Prepare your data
I’ll be using a made up time series. It could be active users on a trading platform per day, it could be daily close price, it could be dApp downloads per day.
Let’s prepare the columns we’ll need: Gains, losses, the relative strength, and the index scaled to 100. We’ll go with length of 7 days here.
Step 2 - The components of Relative strength
The formulas for components of relative strength for both Excel and Google sheets are as follows:

- Gain (latest pair)
=IF(B4-B3>0,B4-B3, 0) - Loss (latest pair)
=IF(B4-B3<0,B4-B3, 0)
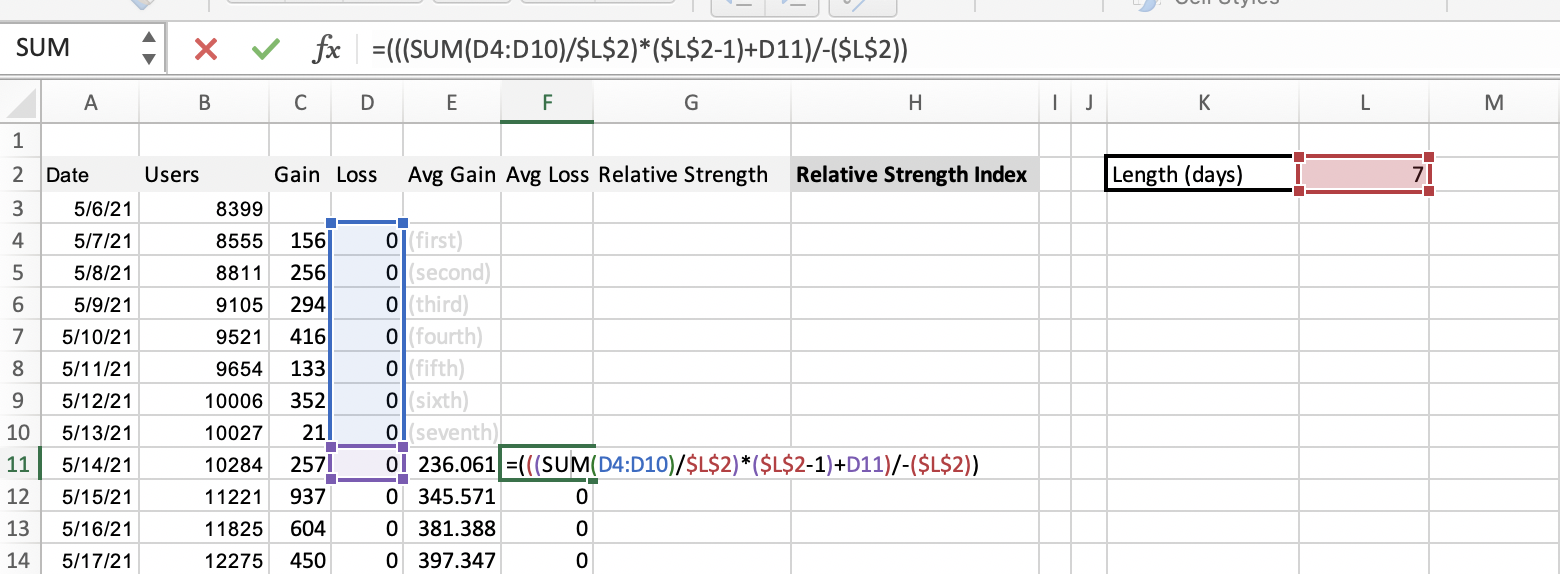
- Average gain (over length, calculations start at date of length+1)
=(((SUM(C4:C10)/$L$2)*($L$2-1)+C11)/($L$2)) - Average loss (over length, calculations start at date of length+1)
=(((SUM(D4:D10)/$L$2)*($L$2-1)+D11)/-($L$2))
Do not forget the minus sign in the average loss component. Both the average gain and average loss need to be positive numbers or zeros.
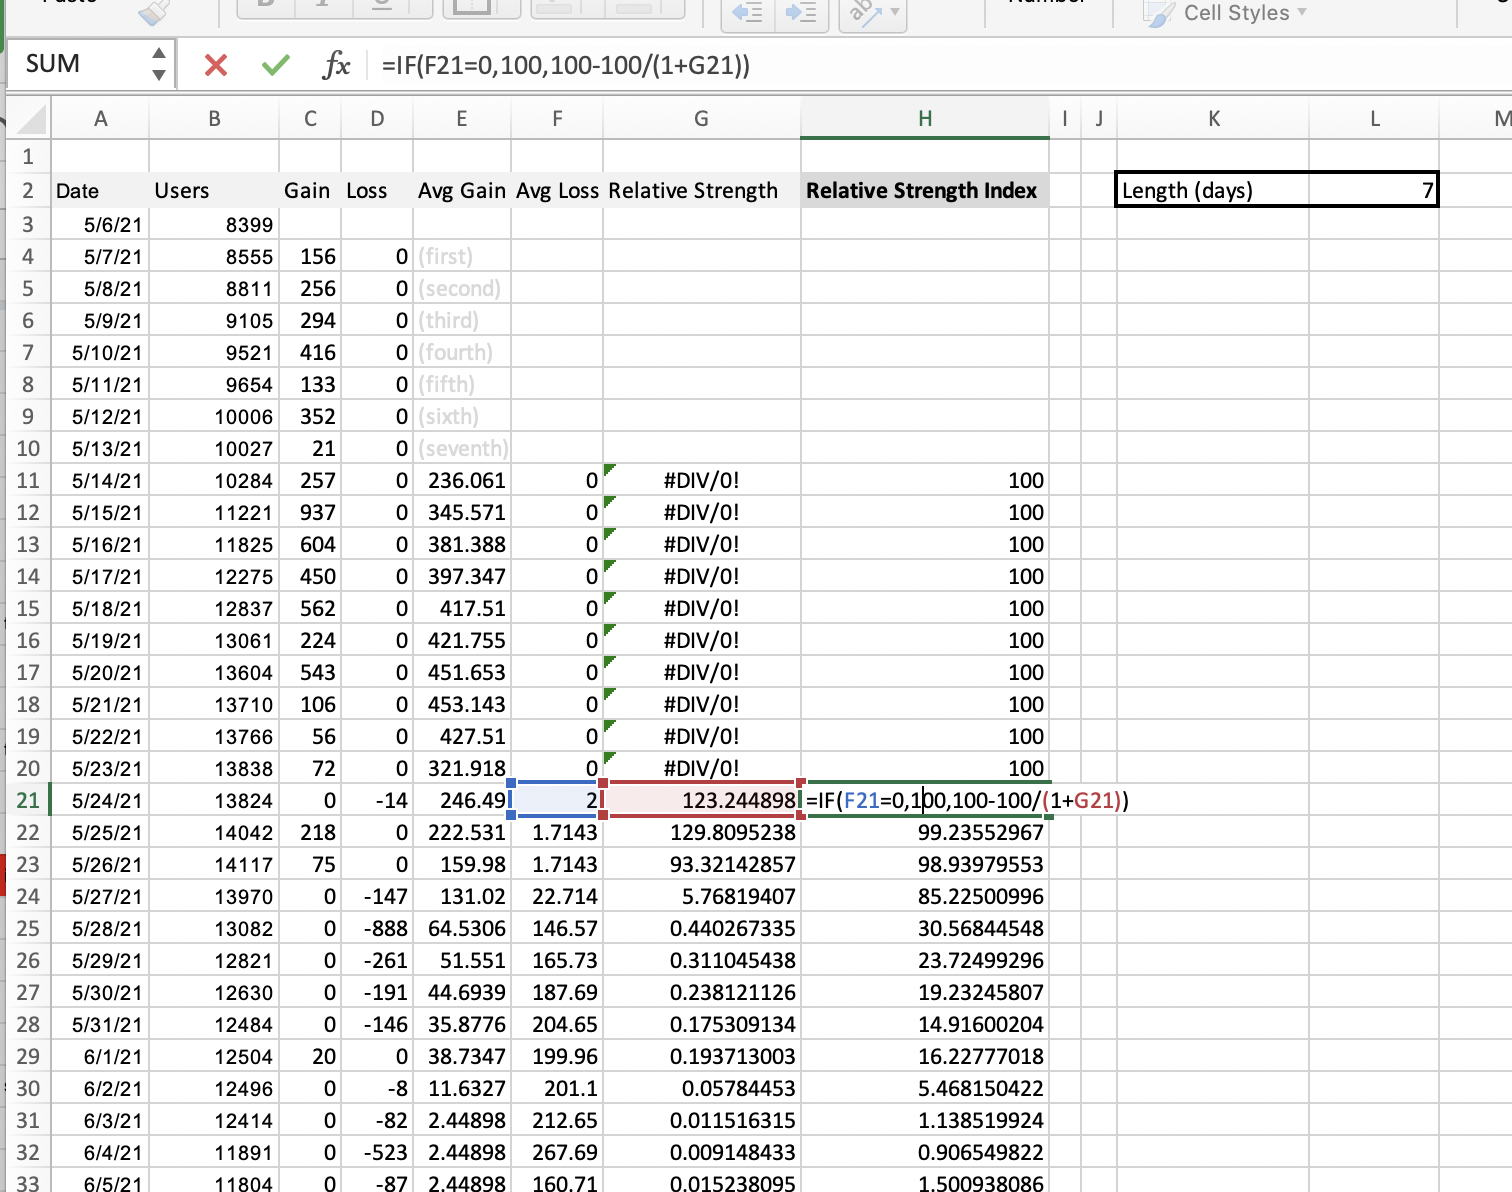
Step 3 - Calculate the relative strength
Relative strength is just the ratio of average gain vs average loss. You get this ratio for every data point by a simple division.
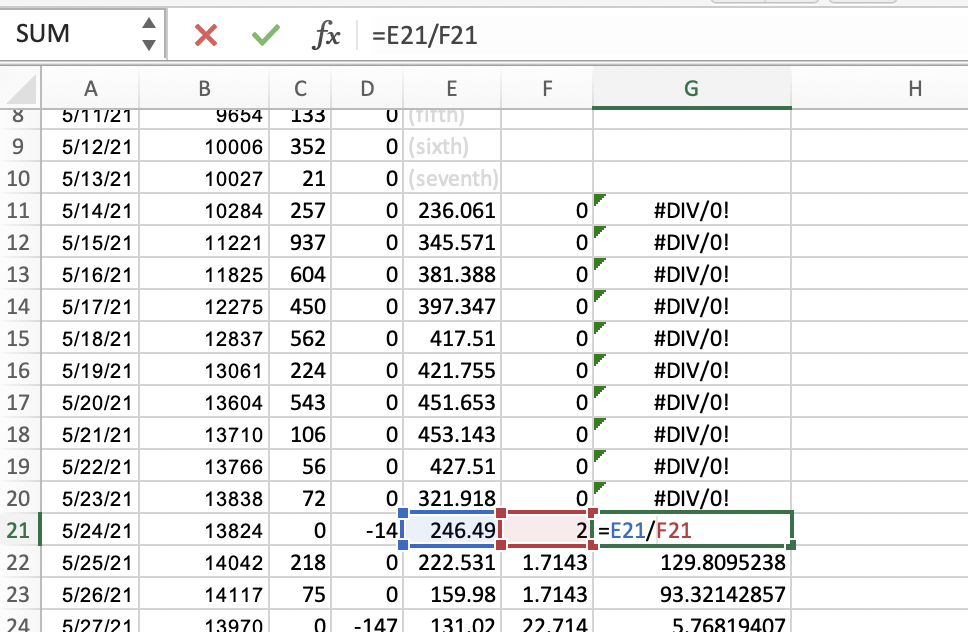
You see that for a lot of data points it will scream errors at you because you are dividing by zero. That’s fine - that’s why we use the relative strength index, not the simple relative strength.
Step 4 - Relative strength to relative strength index
The formula to scale the RS to 100 and thereby make it the RSI goes like this:
=if(=0,100,100-100/(1+))
If the average loss is 0, that is, if we’re gaining without a pause over the whole of our length, then the RSI is maxxed out at 100.
If the average loss is not zero, the RSI becomes 100 - (100 / (1 + RS))
And that’s it. You can plot it into a sparkline chart against the dates.
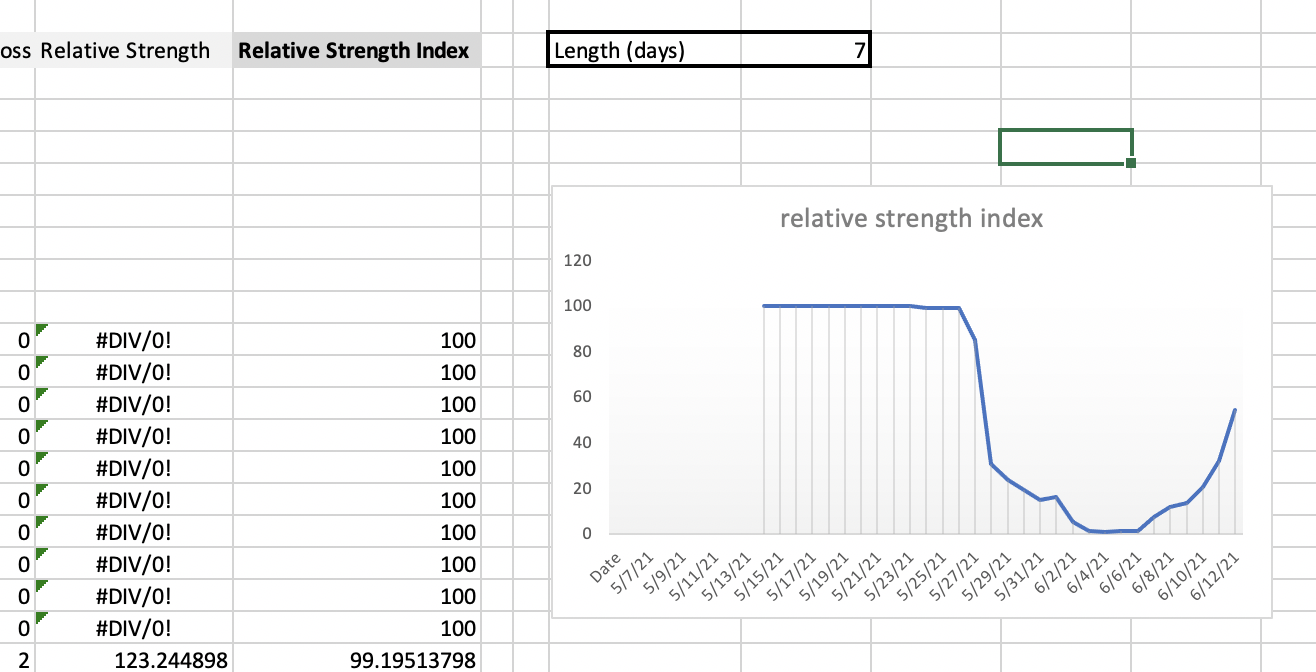
Below once again the final template. You can both use it directly in Google Sheets or download it in xlsx and open in in Excel. No changes required.
RSI transformation formulas in Excel / Google Sheets
Now that you have the RSI values of your data, you can start applying your transformations to it.
What kind of transformation should that be? That depends on what kind of data you are working with.
- If you are a trader looking for more information about price momentum, or volume momentum, you will probably want to apply the stochastic oscillator over your RSI data of price or volume.
- If you are an analyst who wants a single glance information about the state of the market, good-bad kind of thing, you will want to apply the Inverse Fisher.
Those are just two of many options, there are endless mathematical transformations, you just need to know when to use which. But this article is not about that.
Let’s just wrap this up with the formulas for Stochastic and iF transforms, and if you want to learn more about the idea behind them, try it in AltcoinTrading.NET’s strategy.
Stochastic Oscillator of RSI in Excel / Google Sheets
The Stochastic oscillator gives a more refined information about the developing momentum than the plain RSI because it is self-reflexive. It takes into account not just the development of the price (like RSI) but also the development of the RSI itself.
Stoch(RSI) = (RSI - minRSI) / (maxRSI - minRSI)
That is the theoretical formula. In practice you will find you’ll need to adjust it a little for the reading to make any sense.
When in doubt, look at how TradingView pine scripts do it. The public library is a good source of information as people actually use those scripts to trade with their own money.
You will find that the Stochastic RSI uses heavy smoothing:
study(title="Stochastic RSI", shorttitle="Stoch RSI", format=format.price, precision=2, resolution="")
smoothK = input(3, "K", minval=1)
smoothD = input(3, "D", minval=1)
lengthRSI = input(14, "RSI Length", minval=1)
lengthStoch = input(14, "Stochastic Length", minval=1)
src = input(close, title="RSI Source")
rsi1 = rsi(src, lengthRSI)
k = sma(stoch(rsi1, rsi1, rsi1, lengthStoch), smoothK)
d = sma(k, smoothD)
plot(k, "K", color=#2962FF)
plot(d, "D", color=#FF6D00)
h0 = hline(80, "Upper Band", color=#787B86)
h1 = hline(20, "Lower Band", color=#787B86)
fill(h0, h1, color=color.rgb(33, 150, 243, 90), title="Background")
Inverse Fisher Transform of RSI in Excel / Google Sheets
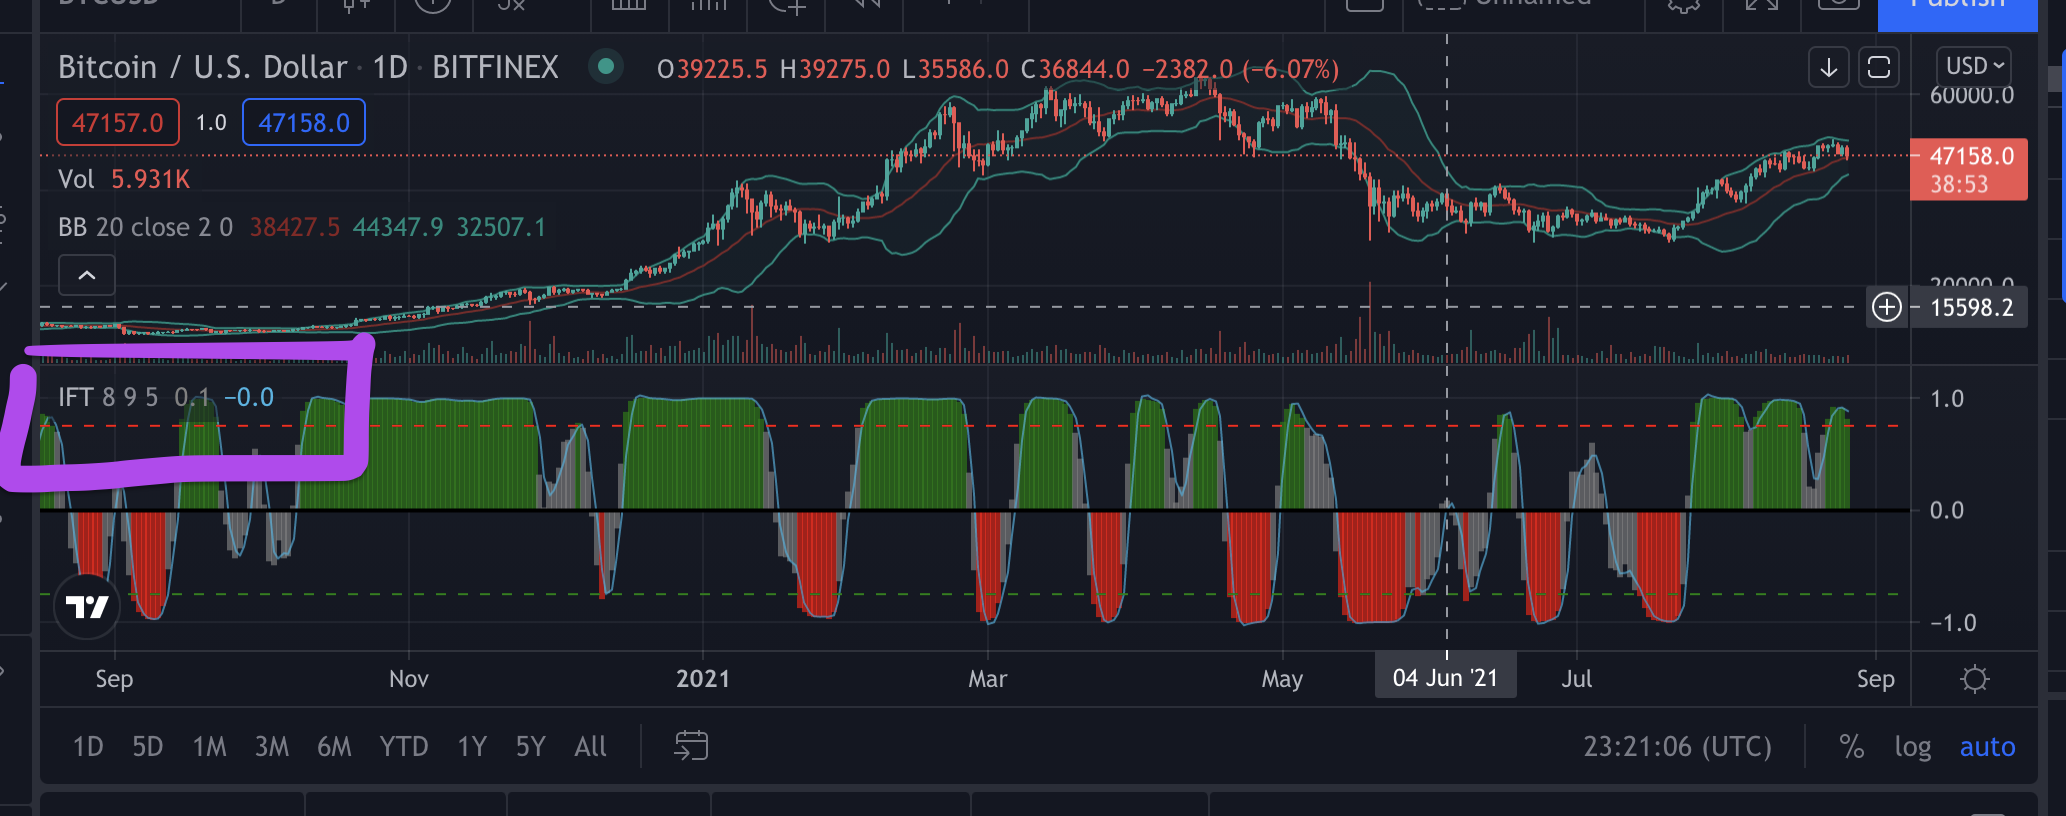
Your work will be much easier with Inverse Fisher transform - the function is built into both Excel and Google spreadsheets. It’s also available on TradingView, as you see above.
However, some random number magic still needs to be applied to it in order to get your result shifted to the area between -1 and 1.
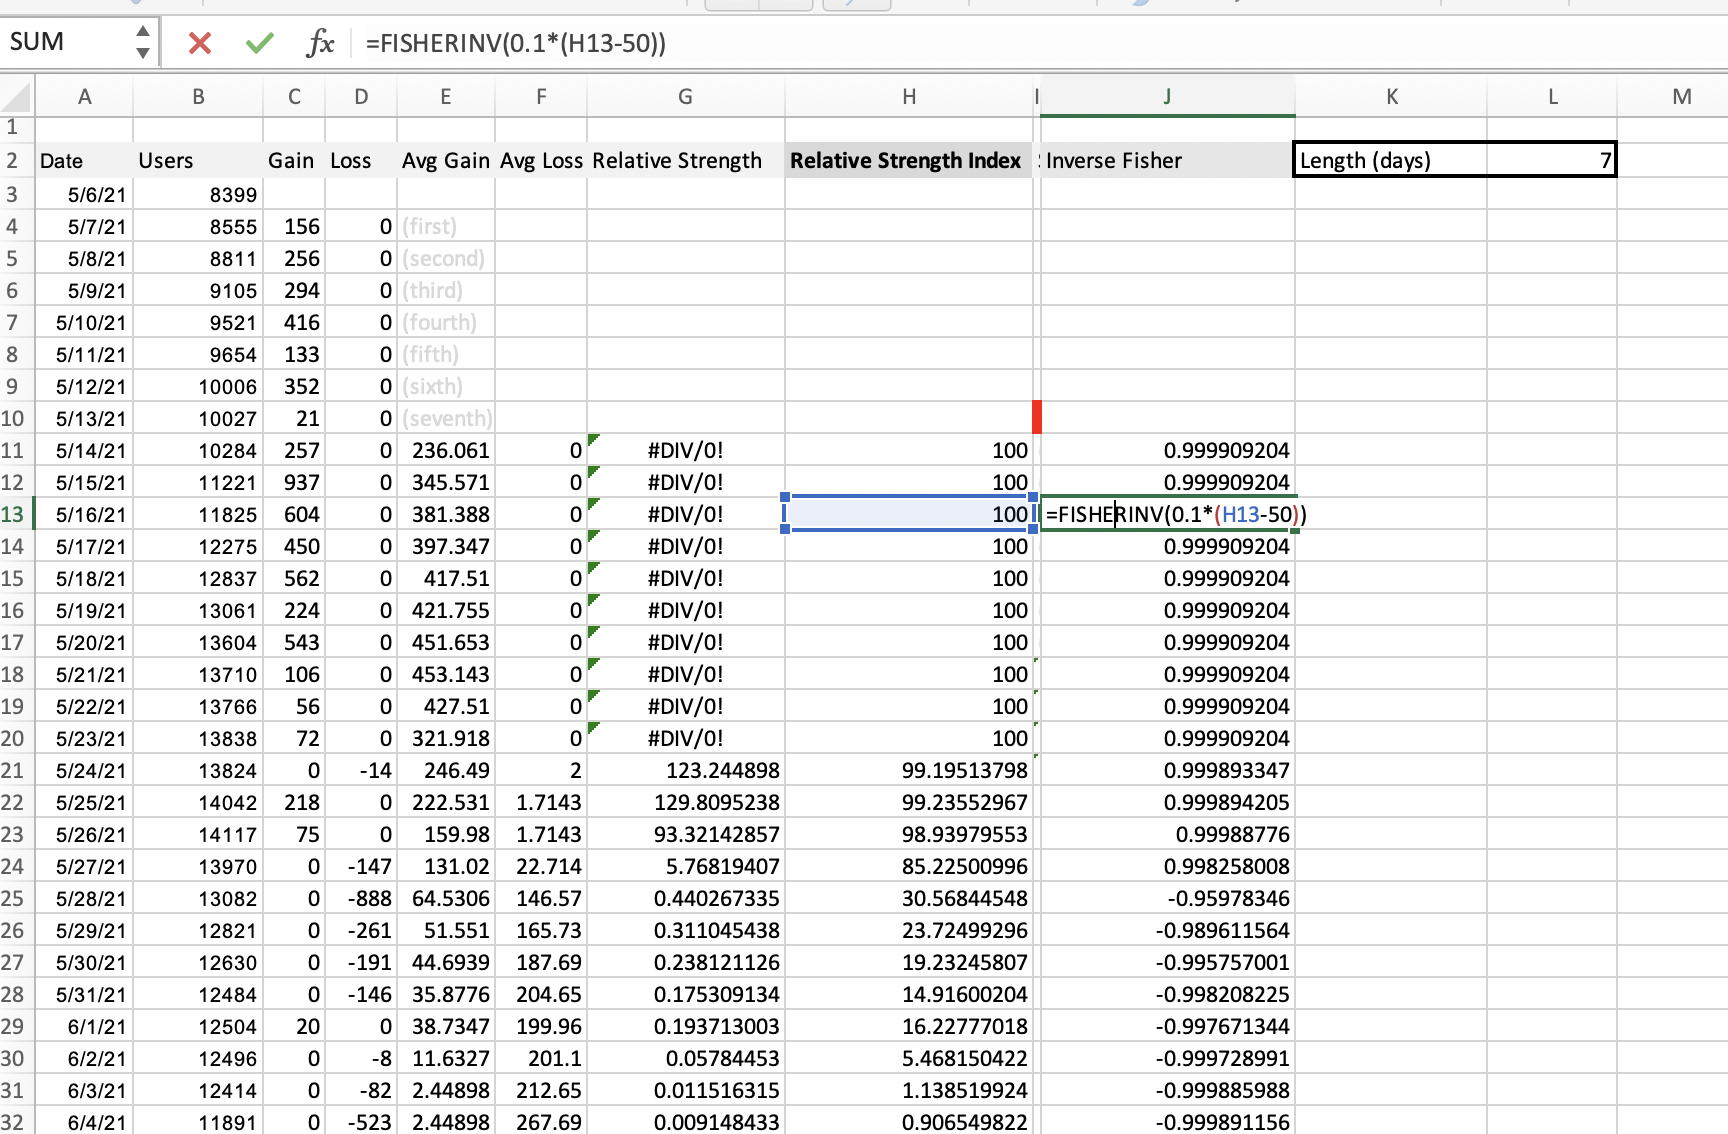
The Excel/Sheets formula for crypto market friendly iF of RSI goes like this:
=FISHERINV(0.1*(-50))
Random numbers but who cares - they do the job every time.
How to interpret Inverse Fisher Transform of RSI
The Inverse Fisher of RSI is a transformation that polarizes and exaggerates the momentum of your data series. That is a good thing for our simple trader brains, because it’s as close to “BUY” vs “SELL” as you’ll get with technical analysis.
However, do backtest your iF with different lengths of RSI on your market of interest. There are several variations of this transformation on TradingView, do look into them.
Final Words
To wrap it up, let’s just repeat that knowing when to use which mathematical transformation is paramount. Good news is it doesn’t require a PhD. Working out the components of different technical tools will help you understand how they work together and why they are used. You will then be able to use them with more confidence, without relying on punts from social media.