
Need help with the spreadsheets?
Post your question into our Google group. Add a link to the page where you got the spreadsheet from, so that others might find it later.
Diversification of your portfolio is a way to describe that you put resources into various assets and currencies to hedge against their volatility.
The thought behind diversified portfolio goes this way: If stocks drop radically, then, at that point some cryptos may appreciate on the same occasion, or if nothing else at least drop significantly less.
Because cryptocurrencies are usually correlated with one another, it can be a good idea to have a portfolio based on stocks as well as crypto, and keep some fiat just in case.
Below is a simple and free Google Spreadsheet that you can use to track your diversified portfolio.
If you are a technical trader, also see our page with RSI Indicators Spreadsheets
How to work with the Portfolio Allocation spreadsheet
First off, if you want to be able to edit this spreadsheet, you’re gonna need to make a copy of it into your own Google Sheets account. Just click “File” and then “Make a Copy”.
After that you’ll be able to edit and adjust anything you want.
This portfolio allocation template is divided into one section for stonks, one section for cryptos and one section for fiat currencies. Your total net worth as well as all market values, including fiat, are done in USD. Wherever possible, the spreadsheet pulls current data from Google Finance for Sheets.
Google finance now includes some of the bigger cryptocurrencies too, but with smaller altcoins you will need to update your prices manually. It’s enough to do that Once every two week, do not spend too much time counting your unrealized PnL!
What to edit
The first thing you will need to set up are your stock tickers, crypto assets and fiat currencies:
![]()
Whenever possible, the spreadsheet will automatically read the ticker and download its price data from Google Finance. Just watch the “Current price” column to see if it updates or if you’ll need to track the price manually.
The next thing to add is your current count of units of each asset that you currently own. You can get this information from your bank accounts, exchange accounts and self-hosted wallets.
The last thing to edit is your invested amount. These columns are marked light blue in this spreadsheet. You should use them to add and subtract any amounts of base currency that you add or remove from your position.
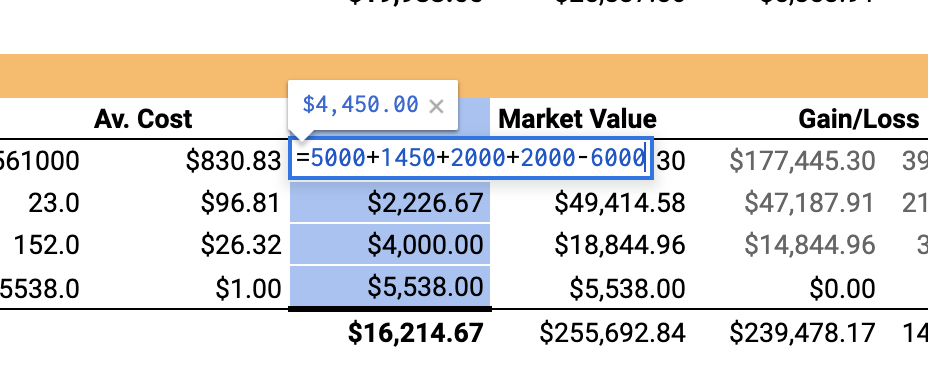
So, your amount invested into BTC can be 5000 USD on the face of it, but the cell can actually contain something like =10000-6000+1000. Your average price per unit will be calculated from this amount and the amount of units you own.
As you rebalance your portfolio in the future, you will only need to update the number of units owned and the fiat money put in or out. Everything else will recalculate automatically.
Get this spreadsheet: Open the Google Sheet - Click "File" > "Make a Copy"