trading-logs
Free Crypto Portfolio Tracker Spreadsheet That Updates Its Own Prices (No API Key, No Script)
Stop Guessing What You Actually Made: A 10-Tab Crypto P&L Kit Powered by GOOGLEFINANCE
A ten-tab Google Sheets kit that separates real yield from price appreciation, prices itself through GOOGLEFINANCE, and tells you which coin is quietly draining the account.
→ Go to Free Crypto Portfolio Manager 360
You open your exchange app. The number is green. You feel great.
That number is one of the least useful pieces of information in your entire trading life.
It does not tell you what you paid, including the gas you burned bridging at the worst possible moment. It does not separate the coin that doubled from the three that bled out underneath it. It does not tell you whether your gains came from being right about the market or from staking rewards that accrued while you were wrong about the market. And it certainly does not tell you what you owe when the tax year closes.
Most traders solve this by paying $15 a month for a portfolio tracker, granting read access to every exchange account they own, and still not understanding where the money went. Or they build a spreadsheet, maintain it religiously for eleven days, and abandon it the moment they have to type in forty prices by hand.
Crypto Portfolio Manager 360 is the second option, minus the abandonment. You log transactions. It does everything else — and it fetches its own prices, live, from Google Finance. There is no API key to register, no Apps Script to authorize, no browser extension, no monthly fee. You import one file and it starts working.
→ Go to Free Crypto Portfolio Manager 360
What it actually answers
- What is my true average entry on each coin, gas and slippage included?
- How much of my profit is price appreciation, and how much is staking yield?
- What has friction — gas, spread, slippage — actually cost me as a percentage of deployed capital?
- Which single position is generating my returns, and which one is dragging?
- How much of my net worth sits on an exchange versus in self-custody versus locked in staking?
- If I sold today, how much of the gain is short-term and how much is long-term?
If you cannot answer those six questions in under a minute right now, you are trading on vibes.
What’s inside
Ten tabs. You maintain exactly one of them.
| Tab | What it does |
|---|---|
| Start Here | Setup, method notes, and the coin-coverage warning. Read it once. |
| Transactions | The only sheet you maintain. Buys, sells, staking rewards, transfers, gas, slippage. |
| Prices | Live price plus 24h / 7d / 30d history, pulled by GOOGLEFINANCE. Zero manual entry. |
| Holdings | True average entry cost, quantity held, market value, portfolio weight, realised and unrealised P&L. |
| Performance | Per-coin performance over 24h / 7d / 30d / since entry — in percent and in dollars of portfolio impact. |
| Fees and Yield | Real net yield after gas and slippage, with staking rewards separated from price moves. |
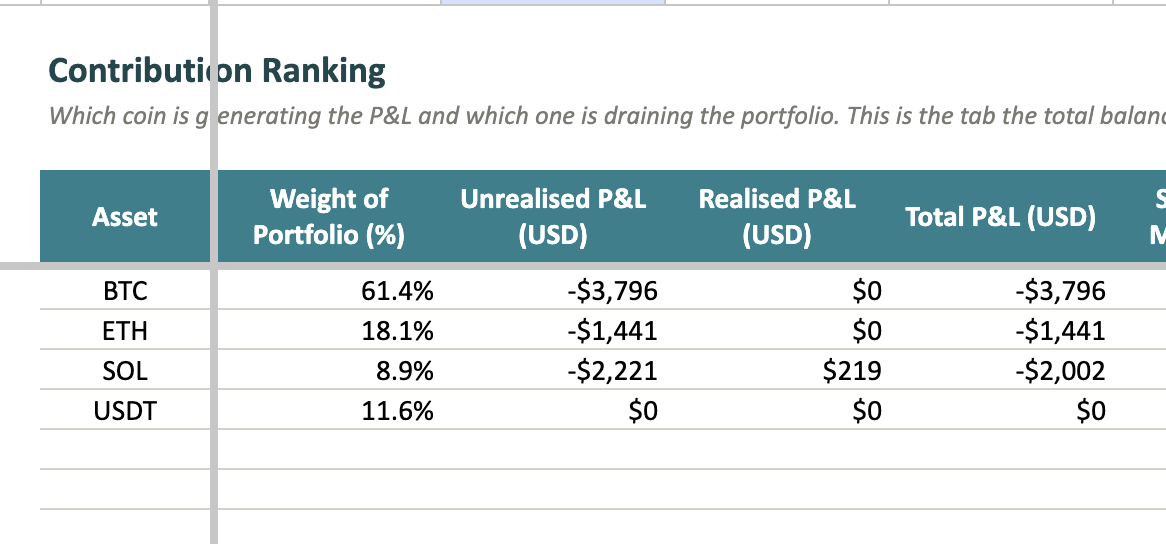
| Contribution | Ranks every position by P&L contribution. Labels each one “Pulling up” or “Dragging down.” |
| Venues | Exchange vs self-custody vs staked/locked, by dollar value and share of portfolio. |
| Tax Lots | Lot-by-lot realised versus unrealised gains, with a short-term / long-term split. |
| Ticker Test | Checks which crypto tickers GOOGLEFINANCE serves today, before you commit a coin to the kit. |
Cream-coloured cells are yours to fill. White cells are formulas — 1,427 of them — and you should leave them alone.
The tab that will annoy you
Contribution. It ranks your positions and puts a plain-English verdict next to each one. Most people discover that a single position is carrying the entire portfolio, and that the “diversification” they added last quarter is a rounding error with extra gas fees.
That is the point. A total balance hides your worst decision by averaging it with your best one.
Under the hood (the technical stuff)
Prices update themselves through GOOGLEFINANCE
Every price cell in the kit is a live call to Google’s own market data function. There is no external API, no key, no quota, and no script to authorize.
Current price, keyed off the ticker in column B so you never edit a formula:
=IFERROR(GOOGLEFINANCE("CURRENCY:"&$B6&"USD"),"")
Historical price, unwrapped from the 2×2 array GOOGLEFINANCE returns for dated queries:
=IFERROR(INDEX(GOOGLEFINANCE("CURRENCY:"&$B6&"USD","price",TODAY()-30,TODAY()-28),2,2),"")
Two details worth internalising if you plan to extend the kit:
Crypto lives under the CURRENCY: namespace. Google treats coins as currency pairs, not equities. GOOGLEFINANCE("BTC") gets you nothing useful; GOOGLEFINANCE("CURRENCY:BTCUSD") gets you a price. Ticker concatenation ("CURRENCY:"&$B6&"USD") is what lets one formula serve every row.
Dated queries return an array, not a value. Ask for a historical price and you get a small table with a header row, which is why the formula is wrapped in INDEX(...,2,2) to pull the single number out. The three-day window (TODAY()-30 to TODAY()-28) exists because a single-date query can land on a gap in Google’s series and return nothing at all.
The whole thing is wrapped in IFERROR so a failed lookup returns an empty cell instead of cascading #N/A through nine dependent tabs.
The honest part: coverage is limited, and Google won’t tell you the limits
GOOGLEFINANCE is the most convenient crypto price source in existence and also the least documented one. Google has never published a list of which pairs it serves, and tickers appear and disappear without notice (FinanceFeeds). Independent testing puts the working set at roughly ten to fifteen majors, with some tickers — LINK among them — behaving inconsistently even though the coin appears on Google Finance’s own crypto page (CoinTable).
Three constraints you should know before you build anything on top of this:
- Quotes are delayed, typically by up to 20 minutes. This is a portfolio tracker, not a trading terminal. Do not price a limit order off it.
- No volume, no market cap. Google’s crypto quotes carry price and not much else. The
volumeandmarketcapattributes that work for equities return nothing for currency pairs (Google Docs Editors Help). - Historical crypto data is the flakiest layer. Live prices are reliable; dated queries are not, and they cannot be reached through the Sheets API or Apps Script at all — the function only evaluates inside a live Sheets grid.
So the kit ships with a Ticker Test tab: 22 candidate tickers pre-loaded, each returning WORKS or NOT SUPPORTED for live price and for 30-day history, plus a verdict column telling you whether the coin is safe to add. Import the file, open that tab, and you have ground truth in five seconds — today, and again in six months when Google silently changes coverage.
We removed coins rather than fake them. LINK, ARB and USDC are not in this kit. USDC in particular is absent from Google Finance’s crypto coverage entirely (Google Finance), so USDT holds the stablecoin row instead — same role in the allocation split, and it is actually quoted. A tracker that displays a stale hardcoded price is worse than one that displays nothing, because you will trust it.
Accounting method
Three decisions are baked into the formulas. If your jurisdiction or your accountant disagrees, this is where to intervene.
- Average-cost basis. Average entry cost per token includes gas fees and slippage paid on the buy, so your break-even is the real break-even, not the exchange’s fill price.
- Staking and farming rewards enter at zero cost basis, valued at the price on the day received. This is what lets the Fees and Yield tab split “the market went up” from “I earned yield,” which are two completely different skills.
- Transfers move coins between venues without touching cost basis. A
Transfer Out/Transfer Inpair keeps your venue map honest while leaving your P&L untouched — moving coins to a hardware wallet is not a taxable event and should not read like one. - Holding-period threshold is set to 365 days for the short-term / long-term split. One cell to change if your rules differ.
Setup
- Go to the spreadsheet
- Click File > Make a copy
- Do NOT ask for edit rights, just make a copy
The gap between traders who compound and traders who churn is rarely alpha. It is bookkeeping. One group knows their true cost basis, their friction drag, and which position is actually paying them. The other group knows a green number in an app.
The spreadsheet is free, it prices itself, and it will take you twenty minutes to populate with your real history.
Then you will finally know.