trading-logs
Free Bitfinex Lending Tracker: What Did You Actually Earn?
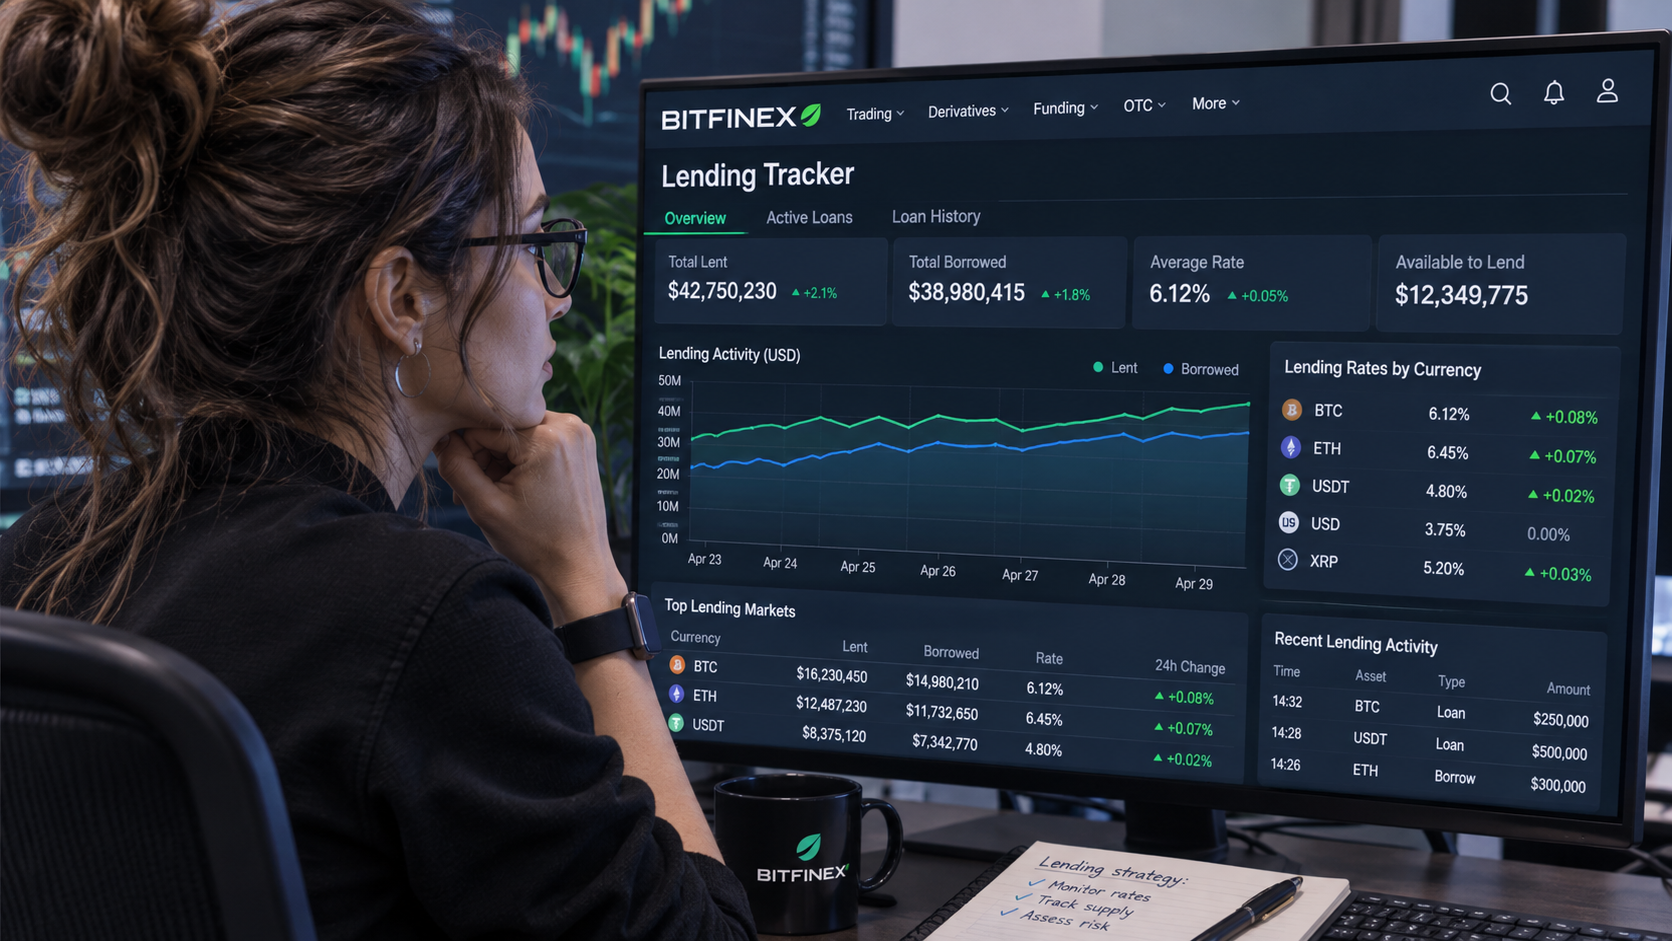
Bitfinex lending is useful because you can earn competitive yields on idle funds without taking a leveraged trade or depositing into a DeFi protocol. When demand for leverage picks up, traders can pay more to borrow: in September 2026, Bitfinex cited USD funding rates of around 8%–11% annualized. That was a snapshot, not a standing rate or what every lender took home.
The other appeal is what you don’t have to manage: no bridge, no on-chain lending pool, and no DeFi lending contract whose bugs you’re exposed to through the loan. Instead, Bitfinex matches you with traders borrowing against collateral. That’s a different set of risks, not a risk-free one: you’re trusting a centralized exchange to hold your funds and handle liquidations, and once an offer is matched, you can’t recall the loan early.
Here’s the part a good-looking funding rate won’t tell you: how much you kept. Bitfinex’s standard fee takes 15% of the interest you earn, or 18% for hidden offers. And any money sitting unmatched in your Funding wallet earns nothing from lending. A great rate on half your balance can leave you with a pretty ordinary return on the whole thing.
That’s why we made the Bitfinex Lending Tracker, a free spreadsheet for Excel or Google Sheets. It uses your Bitfinex CSV exports to show what your loans earned, how much of your capital was actually working, and what landed in your Funding wallet. No API key or account connection required.
Sign up at Bitfinex with a fee discount
→ Download Bitfinex Lending Tracker
What the spreadsheet tells you
The Dashboard separates numbers that are easy to confuse:
| Metric | What it tells you |
|---|---|
| Realized daily rate | The gross rate your loans earned, weighted by how much you lent and how long it was out. A large loan that ran for two weeks counts more than a small loan that ran for an afternoon. |
| — | — |
| Net APR on lent capital | Your weighted rate after the configured Bitfinex fee, annualized without compounding. It measures the money that was actually lent. |
| — | — |
| Utilization | The share of your lending allocation that was out on loan, on average. |
| — | — |
| Net yield on full allocation | The annualized return based on actual ledger payments and all the capital you set aside, including idle funds. |
| — | — |
| Paid vs. expected | What Bitfinex credited to your ledger versus what the spreadsheet estimates from your funding records. |
| — | — |
Say you set aside $10,000 but only $6,000 was lent out on average. That’s 60% utilization. If the money on loan earned a 10% net APR and the ledger payments matched the estimate, your annualized yield on the full $10,000 would be about 6%. The rate wasn’t the problem. Four thousand dollars just wasn’t earning it.
Sign up at Bitfinex with a fee discount
How to use the Bitfinex Lending Tracker
1. Export three CSVs from Bitfinex
Open Account menu → Reports. Use the same export window for all three files, and give yourself a buffer around the period you want to analyze: capture loans that were already open when the period began, and export a few days past the end so you don’t miss the last day’s payout. Bitfinex typically credits funding interest around 01:30 UTC, and the tracker assigns each payment to the previous day.
| Bitfinex report | Spreadsheet tab |
|---|---|
| Funding → Funding Credits | Import_Credits |
| — | — |
| Funding → Funding Loans | Import_Loans |
| — | — |
| Ledgers or Funding Earnings, with the “Margin Funding Payment” entries | Import_Payments |
| — | — |
2. Replace the sample data
Open the workbook and clear all existing contents from the three import tabs, including the sample headers. Then load each CSV into cell A1 of its matching tab, keeping the CSV’s original header row. Leave the Calc_Funding and Calc_Payments tabs alone.
- Excel: Open each CSV, copy it with its headers, and paste it into A1 of the matching tab.
- Google Sheets: Open the workbook in Sheets. In the matching tab, select A1, then go to File → Import → Upload. Choose “Replace data at selected cell” and turn off “Convert text to numbers, dates, and formulas.”
3. Set your currency, dates, capital, and fee
In Settings, edit the yellow cells. Pick one currency at a time: use USD for dollars or UST for Tether, as labeled in the Bitfinex export. Enter your report dates, the total amount you set aside for lending in that currency—not just the amount currently on loan—and the fee that applies to your offers.
Before reading the Dashboard, check the Import check table in Settings. Each required field should show a column number. If you see MISSING, check that you pasted the right CSV into the right tab and included its header row.
4. Read the Dashboard before opening Projection
Start with Interest paid to you and Net yield on full allocation. Then look at utilization to see whether idle funds explain a gap between your lending APR and your overall return. If paid interest differs materially from expected interest, check for missing rows, mismatched report dates, or a missing next-day payout before drawing conclusions. The Dashboard also breaks the results down by month.
Once the historical numbers look right, open Projection. It starts with your realized rate and utilization, then lets you test different assumptions for capital, time horizon, and whether you re-lend your earnings. Use the conservative, base, and optimistic scenarios to see what happens over 90 days or a year, or adjust the 12-month plan month by month. These are scenarios, not forecasts: rates move, and re-offering funds doesn’t mean they’ll match immediately.
The number worth tracking
The funding book tells you what traders are willing to pay right now. Your ledger tells you what you got paid. The tracker puts that payout in context: Was the interest worth tying up that much capital on the exchange?